

Monday to Friday, 8:00am to 6:00pm +254 704 621 587 info@mulan.co.ke

Data Analysis & Visualisation

Dashboards and analysis that turn your raw data into clear answers and better decisions.

Data Analysis & Visualisation

See what your data is telling you

Most organisations already have the data they need to make better decisions; it is just scattered across spreadsheets and systems. We collect, clean and model that data, then build dashboards and reports that answer your key questions at a glance.

From management KPI dashboards to in-depth statistical analysis, we help you measure performance, spot trends early and back decisions with evidence.

One trusted source of truthIncluded as standard

Data Analysis & Visualisation

Python Pandas Jupyter SQL Metabase Power BI Chart.js
What we offer

Data Analysis & Visualisation services

KPI dashboards

Interactive dashboards that track the metrics that matter, updated automatically.

Data engineering

Pipelines that extract, clean and combine data from your systems into one source of truth.

Statistical analysis

Rigorous analysis of trends, drivers and performance to answer business questions.

Automated reporting

Scheduled PDF, Excel and email reports that replace manual compilation.

Geospatial analysis

County and location-based analysis and mapping for planning and operations.

Data literacy training

Helping your teams read, question and use data in their daily work.

What you get

Benefits that matter to your business

  • One trusted source of truth
  • Dashboards updated automatically
  • Insights explained in plain language
  • Faster, evidence-based decisions
  • Secure handling of sensitive data
  • Works with your existing systems

Spreadsheets, SQL databases, APIs, ERP and accounting systems, and CSV exports from almost any platform.

No. We can use open-source tools such as Metabase, or your existing Power BI licences.

We work under a non-disclosure agreement, anonymise personal data where possible and follow the Kenya Data Protection Act.
Ready-made products

Skip the build: start with a proven product

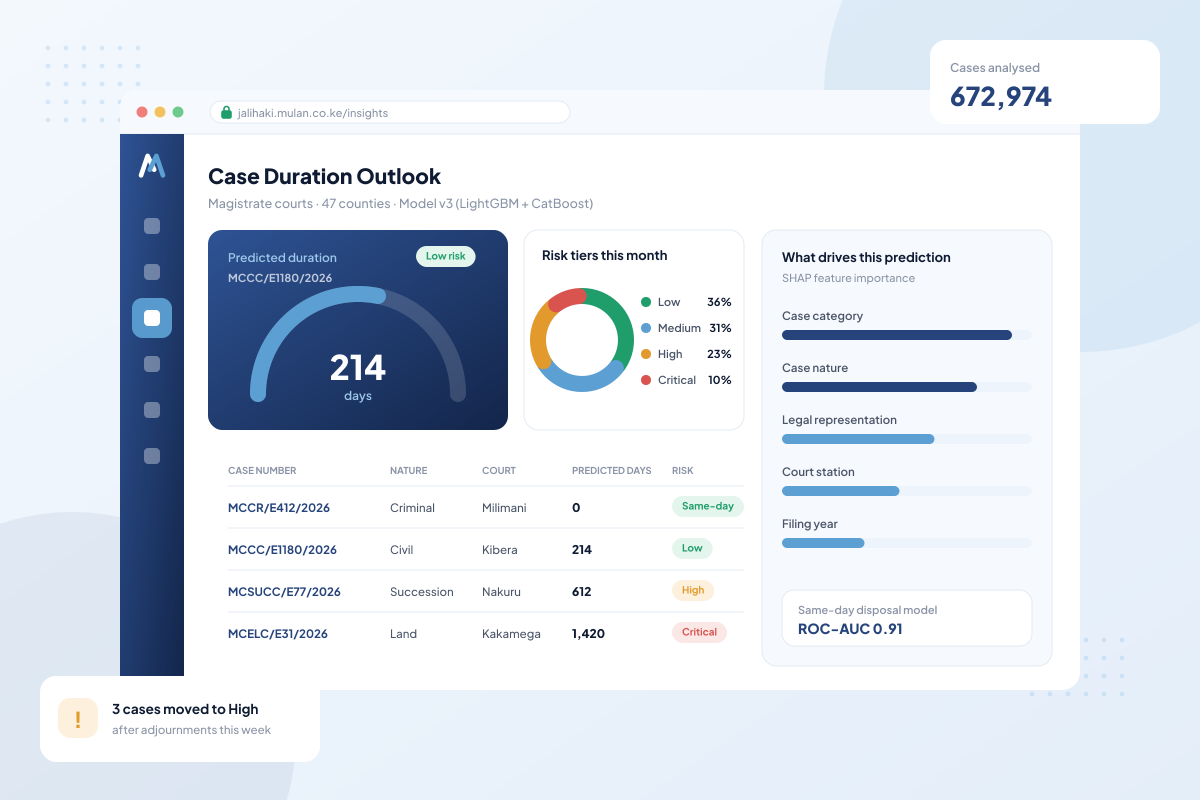
JaliHaki screenshot
Justice & Public Sector

JaliHaki

Predict case duration and manage court backlogs proactively

A machine-learning platform that predicts how long court cases will take, from the day of filing and as they progress, and flags high-risk cases early so courts can manag...

Web dashboard Prediction REST API
Our process

How we deliver data analysis & visualisation

STEP 1

Discover

We learn how your business works, who your users are and what success looks like, then agree on scope, timelines and cost.

STEP 2

Design

We map the user journeys and produce clickable prototypes, so you see and approve the product before we write code.

STEP 3

Build & Test

We develop in short sprints with a demo at the end of each one, and test every release for quality, security and speed.

STEP 4

Launch & Support

We deploy, train your team and stay on to monitor, maintain and improve the system as your business grows.

Let's build together

Let us talk about your data analysis & visualisation project

Share your goals and we will send a clear proposal with timelines and pricing within three business days.

Mulan Technologies
Request a Demo +254 704 621 587